In September 2026 the gap between the cheapest and the dearest hour of electricity in Britain averaged £122 per megawatt hour. That was the widest in over a year. The gap is what a grid battery lives on: it buys the cheap hour and sells the dear one. One owner of ten British batteries reported its best month ever. Bloomberg ran the story as the start of a big winter payout for Europe's $40 billion battery bet. We took the public price data apart to find out what the record was made of.
Jordan Dimov (A115). Published 15 October 2026. Sources and technical notes are at the end.
1. What a battery is paid for
September's spread was about 60 per cent wider than in September 2025. Britain now has 8.5 gigawatts of grid batteries, up from about 2 in 2022. A lot of money rides on whether that month was a trend or a coincidence. This article follows the data step by step, for readers new to energy trading.
A grid battery does one simple thing. Each day the power exchange runs an auction that sets a price for every hour of the next day. The battery charges in the cheapest hours. Those are usually the middle of the day, when wind and solar flood the system, or the small hours, when nobody wants power. It discharges in the most expensive hours, usually the early evening, when demand peaks and the sun has gone. Its income for the day is roughly the difference between those two prices, times the energy it can shift. Traders call that difference the spread. This article measures the simplest version: the highest hourly price of the day minus the lowest.
The two ends of the spread are set by different things. The bottom is set by weather and demand. On a windy, sunny Sunday the cheapest hour can fall to zero or below, because wind and solar farms run whatever the price. The top is set by whichever power station has to switch on to meet the evening peak. In Britain that is almost always a gas-fired plant. A gas plant will not run unless the power price covers its fuel. So the evening price is, in effect, the price of gas with a mark-up. The Energy and Climate Intelligence Unit puts it at about 85 per cent of the time that a gas plant sets the British wholesale price.
What a gas plant's cost looks like
A modern gas plant turns roughly half the energy in its fuel into electricity. So it burns about two megawatt hours of gas for each megawatt hour of power. If gas costs £30 per megawatt hour, the fuel alone costs the plant about £60 per megawatt hour of electricity, before carbon permits and running costs. When gas doubles to £60, that floor doubles to £120. Nothing in the power market has to change for the evening price to double.
That last point is the whole investigation. If the top of the spread is a gas plant's cost, the spread can widen for two very different reasons. One is that the power market has become more volatile, with deeper troughs and sharper peaks. The other is simply that gas has become more expensive and the evening price has followed it up. The first is a story about batteries changing the market. The second is a story about a war. Gas has been near a four-year high since the spring because of the conflict in the Middle East. Which story was September?
2. Two prices that move together
The first step is to put the two prices on one chart. Figure 1 shows, for every month since January 2022, the average daily spread on the British day-ahead auction and the average price of gas. Both are in pounds per megawatt hour.
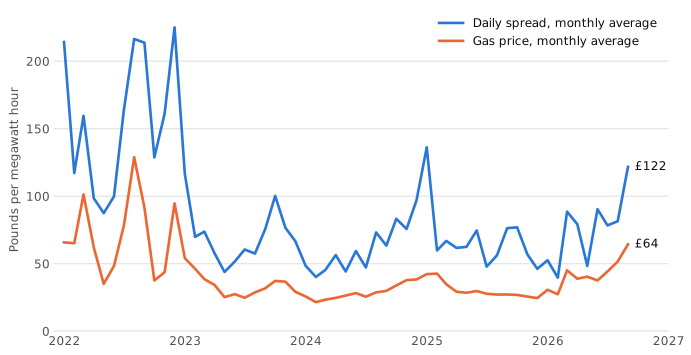
They move together. The 2022 crisis is on the left: gas above £100, the spread above £200. The quiet years are in the middle. On the right, in the spring and summer of 2026, both lines turn up again. September's £122 spread sits on a gas price of £64, the highest since the end of 2022.
That picture says the two are related, which nobody doubted. It does not say how much of the spread is gas. A spread of £122 on £64 gas and a spread of £76 on £27 gas look very different in pounds. The question is whether they still look different once you take the gas out.
3. Dividing one by the other
The cleanest way to take the gas out is to divide by it. Suppose the top of the spread is a gas plant's cost, about twice the gas price, and the bottom is near zero. Then the spread should be about twice the gas price too, and the ratio of spread to gas should sit near 2. A ratio well above 2 means the power market is adding something gas does not explain: deeper troughs below zero, or a scarcity premium above what a gas plant needs. A ratio below 2 means the opposite. Either the cheap hours did not fall all the way to zero, or the evening peak did not quite reach a gas plant's cost. Either way the day's spread is smaller than a gas plant's fuel bill.
Julien Jomaux, who writes on European power markets from Brussels, did this calculation for Germany in September. He found that the German spread, divided by gas, had fallen 14 per cent in 2026. We applied the same arithmetic to Britain. Figure 2 shows the result month by month, with each year's average drawn as a bar.
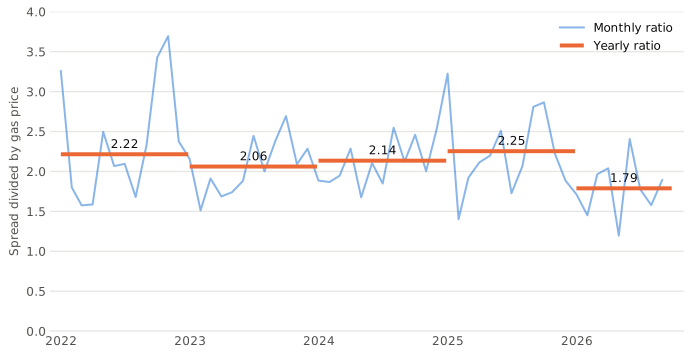
Here is the answer. For three years the British spread was a near-constant multiple of gas: 2.06 in 2023, 2.14 in 2024, 2.25 in 2025. In 2026 to date the ratio is 1.79. That figure runs from January to mid-October, on the days that have both a power price and a gas price. The same days of 2025 gave 2.26. Measured in gas rather than in pounds, the spread has not widened this year. It has narrowed, by about 20 per cent.
September itself makes the point most sharply. September 2025 had a spread of £76 on gas at £27, a ratio of 2.81. September 2026 had a spread of £122 on gas at £64, a ratio of 1.89. The month that produced record battery earnings paid batteries a third less, per pound of gas, than the same month a year earlier. The September spread rose by £45. About £32 of that came from the band that gas sets and about £13 from the premium above it. So most of the rise is gas, not all of it. Over the year as a whole, as the next section shows, the premium actually fell. The power market underneath did not get wilder.
Two cautions. The monthly ratio bounces around a great deal, between 1.2 and 3.2 in the last two years. A single cold snap or a week of low wind can move a month. The yearly averages are the figures to trust, and they tell a consistent story. And the ratio is a rule of thumb, not a law. As Jomaux notes, generators do not bid at a fixed multiple of gas. When gas jumps quickly, the evening price can lag it, which pushes the ratio down for a while. Some of the 2026 fall may be that lag. But the ratio has sat below every previous year's average in eight of the nine months of 2026. That is not what a lag looks like.
4. Where the pounds sit
A ratio is a compact answer, but it hides where the money moved. So we split every hour's price into three bands, following Jomaux's method for Germany. Anything below zero is the negative band: the part of the day when the system pays people to take power. Anything from zero up to a gas plant's cost is the merit-order band, the ordinary working range of the market. We take a gas plant's cost as twice the gas price plus the cost of carbon permits. Anything above that is the scarcity band: the premium the market pays beyond what a gas plant needs. The three bands of each day add up exactly to that day's spread. Figure 3 shows them month by month.
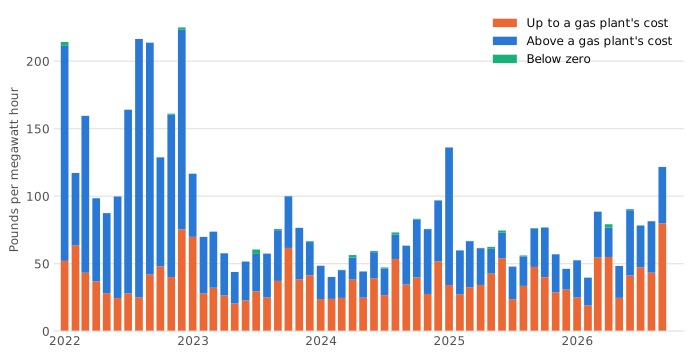
Three things stand out.
First, the negative band barely exists in Britain. It is under one per cent of the spread in every year. That is one possible reason Britain's ratio sits lower than Germany's. Jomaux's figures put Germany at 3.6 for January to September 2025 and 3.1 for the same months of 2026, the 14 per cent fall cited above. Britain was at 2.26 and 1.79 on the same dates. Germany's spread is driven partly by midday prices far below zero on sunny days. Britain has far less solar relative to its demand and a gas plant on the margin more often, so it barely has that leg. We have not tested that explanation here. The German figures are also on hourly prices, while the German auction has been quarter-hourly since October 2025, so the comparison is indicative.
Second, 2022 was a scarcity year. Nearly three quarters of the spread that year was the band above a gas plant's cost. The crisis was not only expensive gas. It was a market paying far more than gas required, because supply was genuinely short.
Third, and this is the part that answers Bloomberg's question, 2026 is the opposite. Compared with the same months of 2025, the merit-order band grew from about £36 to £43 per megawatt hour, because gas lifted the ceiling of the ordinary range. The scarcity band shrank from about £35 to £32. The market pays a gas plant's cost at the peak and less on top of it than a year ago. If you were looking for a sign that 8.5 gigawatts of batteries are starting to flatten the price spikes they earn from, this is it. It is not in the headline spread, which gas has inflated. It is in the premium above gas, which is quietly eroding. September is the exception, and it needs saying. Its premium above gas was £42, against £28 a year earlier: a month of cold weather, low wind and some genuine scarcity. One month does not reverse nine. But it is why the yearly figures, not the record month, carry the finding.
5. Why this matters if you trade the spread anyway
A fair objection: a battery trader captures whatever spread shows up on the day and does not care why it is there. True. The ratio is not for the trader. It is for everyone holding the position longer than the gas price: the owners who underwrite batteries for fifteen years, the lenders behind them, the forecasters, and the people writing contracts on next year's revenue.
The split tells those people which part of their income they can lock in and which part they cannot. The gas part can be hedged. Gas has a liquid forward market, and since 21 September the European exchange EEX lists futures on the daily spread itself. The part that is left is the shape of the day: the depth of the trough and the premium above gas. That is the real structural bet on batteries, and it cannot be hedged. An owner who reads September as the market rewarding batteries is, in effect, long gas at a four-year high without having chosen to be.
The place this bites hardest is the contracts. Most large British batteries now run under an agreement with a trading house that guarantees a minimum annual revenue, called a floor, in return for a share of the upside. In 2025 floors were about 80 per cent of the contracted volume disclosed in Britain. Three counterparties, EDF, Statkraft and SSE, held about three quarters of the market, according to Pexapark. The largest listed owner, Gresham House Energy Storage Fund, put 83 per cent of its fleet under floors in July 2025. Those floors guarantee about £40 million a year before Capacity Market income, roughly £45,000 per megawatt, over the next ten years. They are flat pounds per megawatt. None of the disclosed floors or tolls is linked to the gas price. They were struck when gas was near £30.
So two things are true at once this autumn. Owners on 2025 floors are keeping a windfall above the floor that is mostly gas, and they keep it only as long as gas stays high. Meanwhile the next round of floors is being priced off a year whose revenue is mostly gas. That round covers the fleet coming out of the 2024 toll agreements and the 917 megawatts energised last quarter. A counterparty that prices a floor off 2026 overpays when gas falls. An owner who accepts a 2025-level floor through a gas spike gives the windfall away. Whichever side of that table can take the spread apart has the better of the negotiation. The first instrument that lets either side trade the view, a swap on a battery revenue index between SSE and Statkraft, was signed in September.
Lenders have the same problem in a different form. Debt on a battery is sized on forecast revenue, with a cover ratio of around 1.2 to 1.4. Size it on a gas-inflated spread and the covenant breaks when gas normalises. Developers choosing between a two-hour and a four-hour battery need the shape of the day, not the gas price. A gas spike flatters every option equally and says nothing about duration.
6. What the gas market already says about next winter
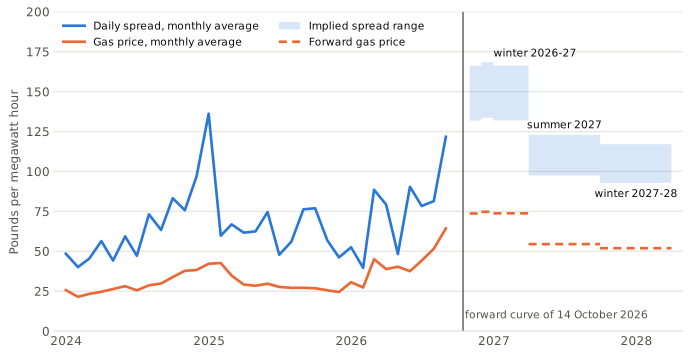
If the spread is roughly a gas multiple, then the gas forward curve, which is public, implies a spread for the seasons ahead. We took the forward gas price for each coming season from a broker's daily report of 15 October. We multiplied it by the range of yearly ratios Britain has shown: 1.79 at the low end, this year's figure, and 2.25 at the high end, last year's. The forward prices are the broker's own indicative estimates, not exchange settlements. We use them because they are the only dated public print of the curve. The exchange's settlements would move the figures a little, not the conclusion. Figure 4 shows the realised spread up to October and the implied range beyond it.
| Season | Forward gas, £/MWh | Implied spread, £/MWh |
|---|---|---|
| Winter 2026-27 (November to March) | 73.9 | 132 to 167 |
| Summer 2027 | 54.5 | 97 to 123 |
| Winter 2027-28 | 51.9 | 93 to 117 |
Table 1. Forward gas is Catalyst Commercial's indicative print of the NBP curve for Wednesday 14 October 2026, from its report of 15 October, converted from pence per therm. It is not exchange settlement data. Winter 2026-27 weights the November, December and first-quarter contracts by their months. The implied spread is the gas price times the yearly ratio range of 1.79 to 2.25, computed on the unrounded figures.
Two things follow. This winter's gas forward, about £74, is above September's £64. So the curve agrees with Bloomberg that the coming winter should be a good one for batteries, with an implied spread above September's £122. And it says plainly that the reason is gas. From April the curve drops by a quarter, and the implied spread drops with it, to about £100 at this year's ratio. That is below this winter but still well above 2025's average of £69, because the curve keeps gas near £54 where 2025 averaged £30. Nothing in that fall, or in that level, is a prediction about the power market. It is the gas market's own view of itself, multiplied by a historical constant.
We will score this. If the ratio for a full season lands more than 0.15 outside the 1.79 to 2.25 range, the structure moved and the multiple is not stable. If the realised spread lands outside the implied range while gas lands within 10 per cent of the forward, the method failed on its own terms. The results for winter 2026-27 will be published after March 2027, and for summer 2027 after September 2027, with whichever of those tests fired.
7. The lesson
September's record was real. The money arrived. But the chart that made the headline, a spread up 60 per cent on the year, was measuring the price of gas with a battery's name on it. Divide by gas and the British spread has been a steady multiple of about two for three years. This year it slipped below that. The premium above a gas plant's cost is shrinking as the fleet grows, exactly as the people worried about batteries eating their own market would expect. The headline spread hid it, because gas rose faster than the premium fell.
For a newcomer the durable lesson is about currency. A number in pounds can be mostly another number in disguise. Before you read a trend into a price, ask what sets that price, and whether that thing moved. In Britain's power market the thing that sets the evening price is gas. In 2026 gas moved a long way, and the spread followed it. That is not a story about batteries. It is a story about what batteries are paid in.
Technical notes
Data. Power prices are the N2EX hourly day-ahead auction for Great Britain, as published on the National Energy System Operator's data portal ("Day-Ahead Power Exchange prices (Nord Pool)"), 20 September 2021 to 16 October 2026, in pounds per megawatt hour, under the NESO Open Data Licence. The auction held on 15 October sets the 16th's prices; the figures use days to 15 October. Gas is the daily System Average Price of gas published by the Office for National Statistics (edition of 15 October 2026), in pence per kilowatt hour, converted at ten pounds per megawatt hour for each penny per kilowatt hour. The gas series runs to 11 October 2026. Carbon is the monthly average UK Emissions Trading Scheme allowance price published on gov.uk (May 2021 to September 2026), plus the Carbon Price Support of £18 per tonne. Forward gas is the NBP table for Wednesday 14 October 2026 in Catalyst Commercial's UK Energy Market Report of 15 October 2026, converted at ten divided by 29.3071 pounds per megawatt hour for each penny per therm. Winter 2026-27 is the mean of the November, December and first-quarter contracts weighted by their months (one, one and three); a simple mean of the three prints gives £74.1 and the same rounded range.
Definitions. The daily spread is the highest minus the lowest hourly price on the printed calendar day, counting days with 23 to 25 hourly prices. The monthly and yearly figures are simple means over days. The ratio is the period's mean spread divided by its mean gas price, over the days that have both prices. For 2026 to date that is 284 of the 288 measured days, because the gas series ends on 11 October, and the spread mean on those 284 days (77.16) is the one the ratio uses. The mean of the daily ratios, which is how Jomaux computes his, gives the same figures to within 0.03 from 2023 on. For 2022 it gives 2.60 against 2.22, because the daily ratios are skewed by that year's gas volatility; both are in the published file. The three bands split each hour's price at zero and at the gas plant proxy of two times the gas price plus 0.4 times the carbon price in pounds per tonne. That is Jomaux's proxy for a combined-cycle plant, not calibrated for Britain, and carbon is a monthly figure, so the boundary is coarse. The 2026 figures run to 15 October for the spread, 11 October for the ratio and 30 September for the bands; "2025 same dates" covers the same calendar days of 2025.
Checks. The September 2026 spread of £121.70 reproduces to the pound the £122 figure published by Modo Energy in its September battery revenue benchmark, and the £64 gas figure in the same report. So the measure here is the one the industry quotes. The gas series is a within-day system price rather than the day-ahead assessment that traders quote. Ofgem's monthly day-ahead gas price (broker data, available to June 2026) differs from it by under one per cent in every month since January 2025, and the January-to-June ratio falls 18.7 per cent on one series and 18.5 per cent on the other. On this measure September 2026 is 59.5 per cent above September 2025. Bloomberg reported 80 per cent, and Modo's own "£45 wider than September 2025" implies about 59 per cent. We have not been able to reproduce the 80 per cent and report ours. Jomaux's German figures are on hourly day-ahead prices and an unnamed gas hub; the German day-ahead auction has been quarter-hourly since October 2025, so his 2026 ratio is not strictly like for like with ours. The N2EX auction is one of two day-ahead auctions in Great Britain; the other, on EPEX, is half-hourly. The 2026 monthly ratios are January 1.71, February 1.45, March 1.96, April 2.04, May 1.20, June 2.41, July 1.77, August 1.58 and September 1.89. The lowest earlier yearly average is 2.06, in 2023.
Every yearly figure. Pounds per megawatt hour except the ratio. The monthly and yearly series behind the figures are published beside this article as monthly-series.csv and yearly-series.csv, derived from the NESO, ONS and gov.uk sources above and reusable under their open licences. The October 2026 row of the monthly file is partial (15 days of spread, 11 of gas) and has no band figures, because October's carbon price is not yet published; a blank is a blank, not a zero, and the note column says so. The aggregation from the raw files to these series is not published with the site; the definitions above are what it does, and the files are its output.
| Period | Gas | Spread | Spread ÷ gas | Below zero | Up to gas plant cost | Above it |
|---|---|---|---|---|---|---|
| 2022 | 71.2 | 157.6 | 2.22 | 0.4 | 42.1 | 115.1 |
| 2023 | 34.4 | 70.9 | 2.06 | 0.4 | 36.2 | 34.3 |
| 2024 | 28.7 | 61.2 | 2.14 | 0.5 | 34.1 | 26.6 |
| 2025 | 30.4 | 68.6 | 2.25 | 0.4 | 35.8 | 32.3 |
| 2025, same dates as 2026 | 31.8 | 71.7 | 2.26 | 0.6 | 36.3 | 34.9 |
| 2026 to 15 October | 43.1 | 77.7 | 1.79 | 0.4 | 43.4 | 31.9 |
| September 2025 | 27.2 | 76.3 | 2.81 | 0.6 | 47.6 | 28.2 |
| September 2026 | 64.3 | 121.7 | 1.89 | 0.1 | 79.9 | 41.7 |
References.
- Bloomberg (15 October 2026). Europe's $40 Billion Battery Bet Set for Big Winter Payout. Eamon Akil Farhat.
- Modo Energy (October 2026). ME BESS GB: Revenues rise to £99k/MW/year in September 2026; GB BESS buildout Q3 2026: record quarter takes fleet to 8.5 GW.
- Jomaux, J. (24 September 2026). The evolution of the spread: 2026 update. GEM Energy Analytics.
- Energy and Climate Intelligence Unit (3 October 2025). Marginal Gains: how wind is pushing gas out of the power market and cutting costs.
- Gresham House Energy Storage Fund (July 2025). Long-term floor agreements agreed on 789MW of battery projects; floor agreement with EDF (29 July 2025).
- Pexapark (10 March 2026). GB BESS: shift to tolling as competition intensifies. Apostolis Valassas.
- Statkraft (September 2026). Statkraft and SSE complete industry-first swap; Modo Energy (14 September 2026) on the same transaction.
- EEX (22 July 2026, launch 21 September 2026). EEX extends renewable energy hedging portfolio: TBx and Block futures.
- Catalyst Commercial (15 October 2026). UK Energy Market Report. Forward season levels are the publisher's indicative editorial estimates, quoted with attribution.
- National Energy System Operator, Day-Ahead Power Exchange prices (Nord Pool); Office for National Statistics, System Average Price of gas; gov.uk, UK Emissions Trading Scheme markets.