Britain's power cables to the Continent carried electricity towards the cheaper market in about one hour in six this autumn. That is the visible cost of trading outside Europe's coupled power market. It is worth about £34 million a year at the rate of seven expensive autumn weeks. The larger loss is harder to see: cables that ran the right way, but far from full.
Jordan Dimov (A115). Published 12 November 2026. Sources and method are at the end.
Why this matters now
The UK and the EU hold a summit on 20 November 2026. Electricity is on the table. The two sides agreed in May 2025 to explore Britain's return to the EU's internal electricity market, and in December 2025 they set out what that would mean: taking part in the EU's trading platforms "in all timeframes", in exchange for following EU electricity rules as they change. EU governments gave the European Commission a mandate to negotiate in March 2026. It covers two agreements: one on electricity, and one on a British payment towards the EU's poorer regions. The mandate says the two should "enter into force and apply simultaneously".
The open question is money. On 10 November, the leaders of Germany, Belgium, the Netherlands, Denmark and Luxembourg wrote that a British payment into the EU's regional funds "should be linked" to electricity market access. The UK government says nothing has been agreed, and that any payment must "deliver value for money for Britain". Nothing had been signed when this was checked.
So what is market access worth? Published estimates of the cost of separation run from about €30 million a year to several hundred million pounds. We wanted to see where a number like that comes from, using only data anyone can download.
What coupling is
Most of Europe clears its day-ahead power markets in one auction. A single calculation sets the price in every country and decides the flow on every border at the same moment. Power is sent from the cheaper country to the dearer one until the prices meet or the cable is full. Nobody has to guess which way a cable should run. This is market coupling.
Britain was part of it until the end of 2020. Since then, a trader who wants to move power across the Channel has had to do two things separately: buy the right to use the cable, in an auction of capacity, and buy and sell the power itself, in two markets that clear at different times. The trader commits to a direction before the prices are known. How power trading works covers the British auctions; the 2020 trade agreement promised a replacement arrangement that was never built.
When the guess is wrong, power flows from the dear market to the cheap one. The European regulators' agency, ACER, counts the hours in which that happens as a standard measure of how badly a border works.
What we measured
We took the metered flow on each of the seven cables between Great Britain and the Continent, hour by hour, and compared its direction with the difference between the British day-ahead price and the day-ahead price at the other end. The British price is the Nord Pool auction price. Nord Pool makes it public for about two months back, so the period is 12 September to 31 October 2026: 50 days, about 1,200 hours for each cable.
Three questions:
- In how many hours did power flow towards the cheaper market?
- What was that power worth, at the price difference of the hour?
- When the prices differed, how often was the cable full in the right direction?
Result one: the wrong way, one hour in six
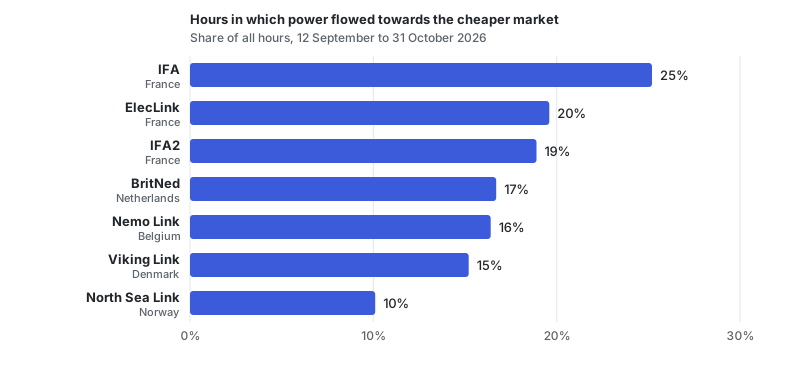
Across the seven cables, power flowed towards the cheaper market in 10% to 25% of hours. The three cables to France were the worst. The cable to Norway was the best, and Norway was the cheaper market in more than four hours in five, which makes the direction easy to call.
Most of these hours are close calls. When the two prices were at least £20 per MWh apart, the wrong-way share fell under 2% on IFA2, BritNed, Nemo Link and Viking Link, and to between 3% and 8% on IFA, ElecLink and North Sea Link. Traders rarely get a large difference wrong. They get small ones wrong often, as you would expect from people committing before the prices are known.
In energy, about 700 GWh out of 5,880 GWh went the wrong way, which is 12%.
Not every one of these hours is a trader's mistake. The flows are metered, so they include trades made after the day-ahead stage and trades by the system operator, and a few such hours would occur in a coupled market too. The figures here are the most that day-ahead separation can be blamed for.
Result two: what the wrong-way power was worth
Multiply each wrong-way megawatt-hour by the price difference in its hour and the total is £4.7 million over the 50 days. Scaled to a year, that is about £34 million.
| Cable | To | Wrong-way hours | Wrong-way value, 50 days |
|---|---|---|---|
| IFA | France | 25% | £1.2m |
| ElecLink | France | 20% | £0.8m |
| IFA2 | France | 19% | £0.5m |
| BritNed | Netherlands | 17% | £0.5m |
| Nemo Link | Belgium | 16% | £0.3m |
| Viking Link | Denmark | 15% | £0.6m |
| North Sea Link | Norway | 10% | £0.8m |
| All seven | £4.7m |
That figure, a rate from seven weeks and not a forecast, sits close to the lowest published estimates. Researchers at Cambridge put the cost of uncoupling at about €31 million a year in 2021. LCP Delta, cited by Energy UK, put the extra cost of day-ahead trading at £17 million a year. Our seven weeks were expensive ones, with British power averaging £142 per MWh, so a calmer year would give a smaller number.
Over the same 50 days, the power that flowed the right way was worth £168 million at the same price differences. The wrong-way flow is under 3% of that.
Result three: the right way, but not full
In a coupled market, a cable is full whenever the two prices differ, apart from outages and technical limits. That is the point of the calculation: keep sending power until the prices meet or the cable cannot carry more.
Britain's cables were mostly not full. The two prices differed by at least £5 per MWh in 70% to 88% of hours. In those hours, this is how often each cable ran at 90% or more of its capacity in the right direction:
| Cable | To | Full in the right direction |
|---|---|---|
| North Sea Link | Norway | 72% |
| Viking Link | Denmark | 50% |
| IFA2 | France | 42% |
| ElecLink | France | 26% |
| BritNed | Netherlands | 24% |
| Nemo Link | Belgium | 17% |
| IFA | France | 15% |
Value every unused megawatt at the price difference of its hour and the total is £74 million over the 50 days. It splits three ways:
- £40 million in hours when the cable ran the right way but below its capacity;
- £22 million in hours when the cable was idle;
- £12 million in hours when it ran the wrong way. This is the capacity that should have run the right way in those hours; the £4.7 million above is the power that ran against it.
This is a ceiling, and a high one. Some of the idle hours are outages: ElecLink was idle in more than a quarter of those hours, which no trader chose. Cables cannot reverse instantly. System operators sometimes restrict them for the grid's sake. And a coupled market would not capture the whole amount either, because sending more power narrows the price difference it is chasing.
But the size of the gap explains the argument. Count only power that went the wrong way and separation costs tens of millions a year. Count capacity that went unused while prices differed and the number is more than ten times larger. The larger published figures count more than wrong-way power. Energy UK's range for 2022, £120 million to £370 million, is its estimate of what less efficient trading arrangements added to electricity costs as a whole.
What it means for the negotiation
Three things follow from the data.
The narrow loss is small beside the sums being discussed. The five governments' letter does not name a figure. Euronews compares the request with Norway, which it says pays about €391 million a year in grants as a member of the European Economic Area. That is about £330 million at this autumn's exchange rate, or about ten times the wrong-way power we measured, at its yearly rate. Norway's grants pay for the whole single market, not for electricity alone, so this is a sense of scale and not a price. The under-used capacity, scaled the same way, comes to about £540 million a year, and that figure is a ceiling.
The under-use is where the case for coupling has to be made. It is also the part that outside data cannot settle. How much of the unused capacity was available to trade, hour by hour, is known to the cable operators and the system operators. That is the number the argument about the price of market access turns on.
The benefit grows with the cables. The seven cables in this data can carry about 9 GW between them, by their own peak flows, and more are planned. Each one adds capacity that separate auctions use less well than a coupled one would.
What would change on a trading desk
If Britain rejoins, the change for a power desk is practical.
- One day-ahead auction. Today Britain's two exchanges run separate auctions, at 09:20 and 09:50. The coupled European auction closes at 12:00 Central European Time. A British desk would bid into that, and get one price.
- No separate capacity auction for the next day. The right to use a cable would be allocated by the same calculation that sets the price. The cross-border desk's daily bet on direction disappears.
- Quarter-hours. The coupled auction has traded in 15-minute periods since October 2025. Britain settles in half-hours. Systems would have to hold both.
- Intraday across the border. "All timeframes" includes the continuous intraday market, where a British order could match a continental one directly.
None of this is agreed, and none of it would happen quickly: joining the European auction is a project for exchanges, operators and every participant's systems. A desk that builds its own tools should know which of them assume a British auction at a British time.
Method and limits
Period. Delivery hours from 22:00 UTC on 11 September 2026 to 23:00 UTC on 31 October 2026: 1,201 hours with a price at both ends. Nord Pool's delivery days run on Central European Time, so the period is 12 September to 31 October on that clock. The start is set by what Nord Pool publishes without a subscription.
Flows. Elexon's half-hourly metered interconnector flows (dataset INTOUTHH), averaged to hours. These are physical flows. They include trades made after the day-ahead stage and any trades made by the system operator, so not every wrong-way hour is a trader's day-ahead mistake. A flow under 50 MW counts as idle, and is not counted as wrong-way either. An hour with no price difference counts as neither right nor wrong.
Prices. For Great Britain, the Nord Pool N2EX day-ahead auction price, hourly, in pounds. Britain's other exchange, EPEX SPOT, runs its own auction and its prices differ slightly. For France, the Netherlands, Belgium, western Denmark (DK1) and southern Norway (NO2), day-ahead prices from Energy-Charts (Bundesnetzagentur, SMARD.de, CC BY 4.0), averaged from quarter-hours to hours and converted at the European Central Bank's daily reference rate.
Capacity. Each cable's capacity is taken as the 99th percentile of its own hourly flow in the period, which came out between 1,020 MW and 1,060 MW for the four 1,000 MW cables, about 1,440 MW for the two 1,400 MW cables and 2,000 MW for IFA. Each is at or just above the cable's rating, so capacity is not understated. It is the same in every hour, though, which ignores outages and partial restrictions. That is why the under-use figure is a ceiling.
A check that changed the result. We first ran a full year, 1 November 2025 to 31 October 2026, using Elexon's market index price for Britain, which is public for any date. That index is built from trades close to delivery, not from the day-ahead auction. Over the seven weeks where both prices exist, it gave a wrong-way value of £18.8 million against £4.7 million from the auction price. It measures something different: how far flows scheduled the day before had drifted from prices near delivery. We have not used it for any figure above.
One script. Every measured figure above comes from a single script that downloads the datasets listed under Sources and nothing else. The yearly rates and the conversion of the Norway figure are simple multiplications on top.
Scaling. "About £34 million a year" and "about £540 million a year" multiply 50 autumn days by 365/50. They are rates, not forecasts.
Sources.
- UK Government, UK-EU Summit: key documentation: the Common Understanding of 19 May 2025, and "Outcome of the exploratory discussions on the possible participation of the United Kingdom in the European Union's internal electricity market", 22 December 2025.
- Council of the EU, Council greenlights talks on electricity and cohesion deals, press release, 30 March 2026.
- Euronews, Five EU countries demand UK pays for electricity market access, 10 November 2026.
- Guo, B. and Newbery, D. (2021). The cost of uncoupling GB interconnectors. EPRG Working Paper 2102, University of Cambridge.
- Energy UK, The cost of the UK-EU relationship for energy, 24 October 2024.
- Data: Elexon, Insights Solution, interconnector outturn (INTOUTHH) and market index data. Nord Pool, day-ahead prices for the UK (N2EX). Energy-Charts, day-ahead prices by bidding zone. European Central Bank, euro reference rates.